Duration — 1280×720 · 16:9 landscape Remotion Remotion + React
Run log
ModelClaude (agent build)
Renderer / stackRemotion + React
Iterations to final1
Render time28s (final render)
Format1280×720 · 16:9 landscape
Published2026-10-25
What broke (and the fix)
- Nothing broke — the final-frame still was clean and the first render shipped.
Original prompt Tested
Report explainer — Remotion prompt (dense report condenses to stat cards)
by MotionPrompts (own run)
Prompt
Banned list —Beat grid —Build method —Self-review —
<direction>
A 9-second report explainer in Remotion (1280x720, 270 frames at 30fps). House style: near-black #0a0a0a background, panels #141414, borders #2a2a2a, text #ffffff/#c9c9c9, ONE accent #ff5c1a, Arial/Helvetica bold, no webfonts. A dense 40-page report page dissolves into the only screen anyone reads: three stat cards and one chart. Fictional company; every figure labelled SAMPLE DATA in the film. No gradients, no stock photos, no real brand logos, no lorem ipsum, no purple/blue tech gradient.
</direction>
<structure>
Frames 0-92 — Kicker "REPORT EXPLAINER — Northwind Labs Q3". Headline: "The 40-page report, in one screen." A report page card rises centre: title "QUARTERLY REPORT — Q3", Northwind Labs, eleven grey text lines, and the weary caption "…AND 39 MORE PAGES LIKE THIS".
Frames 92-148 — The page fades and shrinks away; three stat cards (accent borders) land in a row: REVENUE +18% / NEW USERS 4,208 / CHURN −0.6 PTS, each with a one-line plain-English sub.
Frames 148-216 — A chart strip lands under the cards: "REVENUE BY MONTH — Q3 (SAMPLE DATA)" with five bars growing, the last in accent.
Frames 216-270 — Closing row: "READ THE FULL REPORT ↓" pill + "ALL FIGURES ARE SAMPLE DATA FOR A FICTIONAL COMPANY".
</structure>
<build>
One component; the page-to-cards handoff is an opacity/scale crossfade on clamped interpolations (no layout animation). Bars grow by interpolating their height percentage with the strip's fade. Stat values are constants — in adaptations they must be the report's real headline numbers, with the sample labels removed only then.
</build>
<gotchas>
- The joke caption ("39 more pages") must be TRUE of the format you're adapting — count the real report's pages.
- Keep exactly three stat cards: the format's promise is ruthless selection; a fourth card breaks the pitch.
- Check the final frame as a still: cards + chart + CTA + sample-data line all present, nothing clipped at 720px height.
</gotchas>
Before you finish: step through the timeline at five points and fix anything that overlaps, clips the frame, or drifts off the beat grid.
Use this prompt
Runs as written. Works for any periodic report — investor updates, agency monthlies, SEO reports: page, three stats, one chart, one link.
Related videos
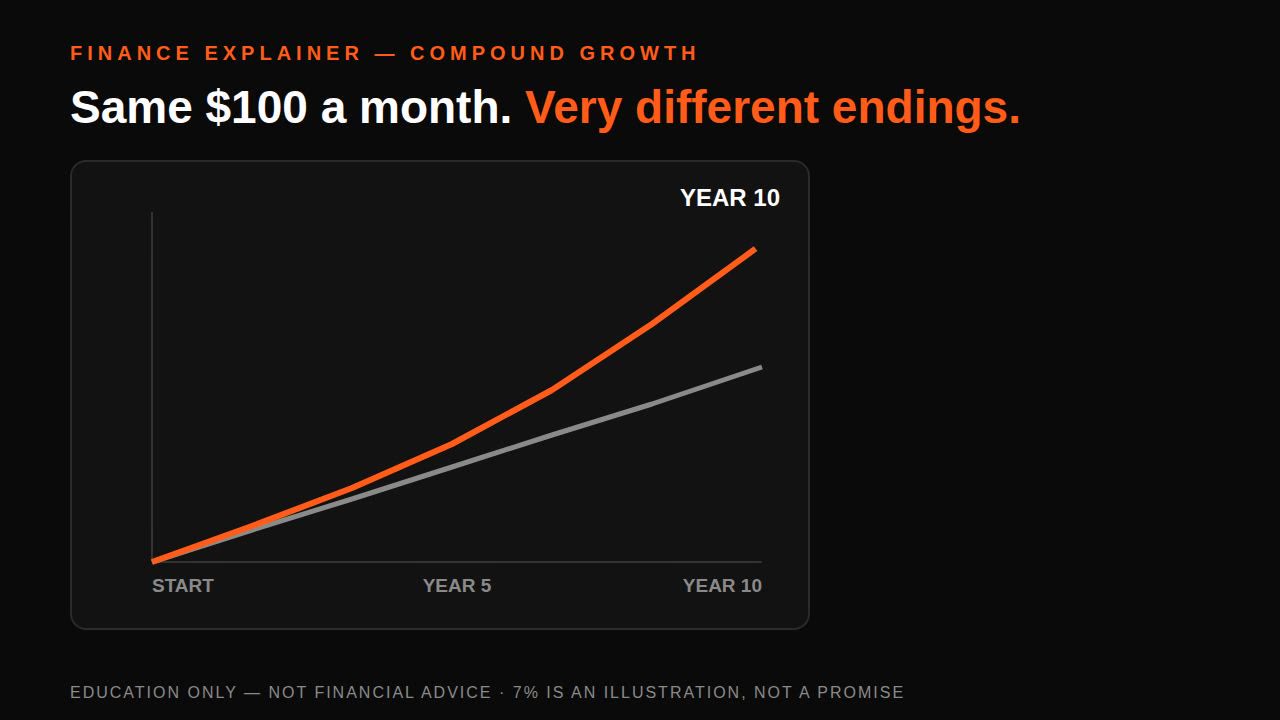
Compound growth explainer — Remotion prompt (two-line chart, illustrative framing)
Remotion·16:9 landscape Tested
Product UI morph — one shape, many states
HyperFrames·Square Tested
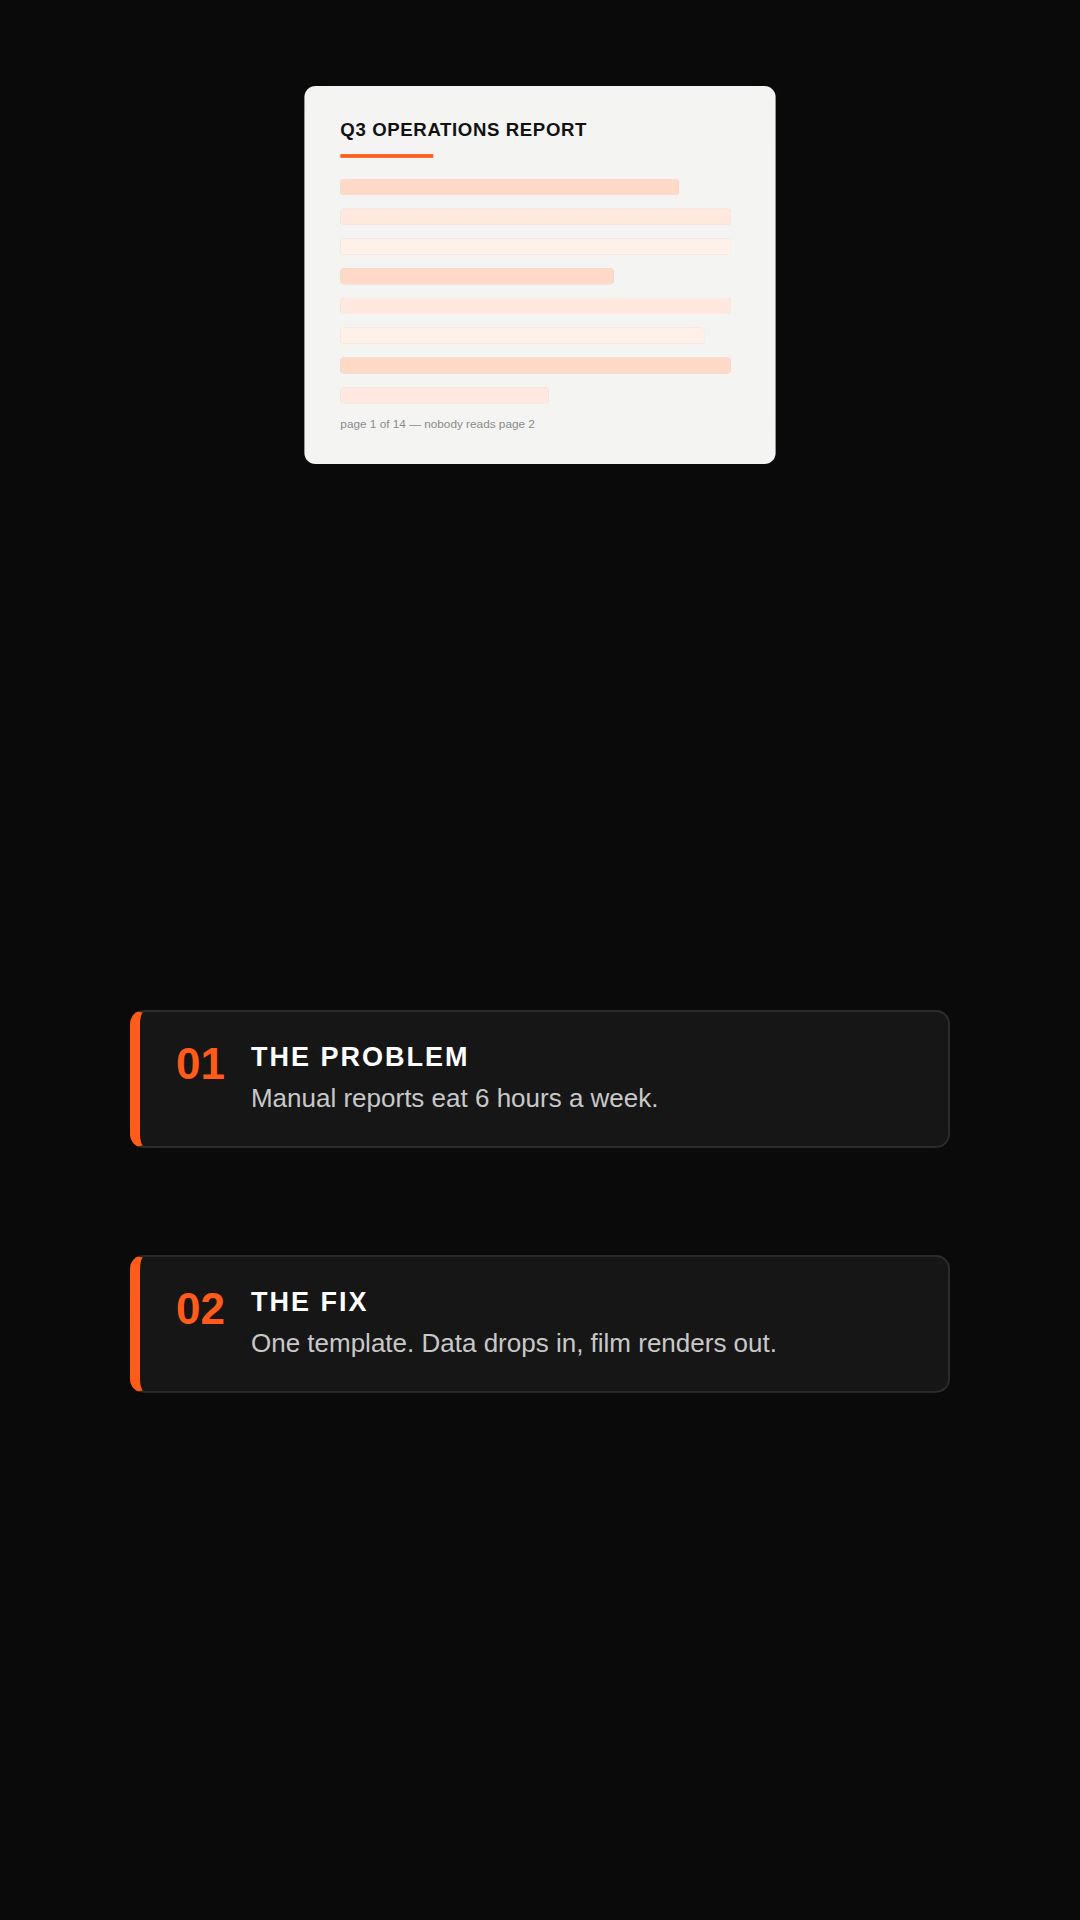
Remotion explainer prompt — document to vertical video
Remotion·Vertical Tested
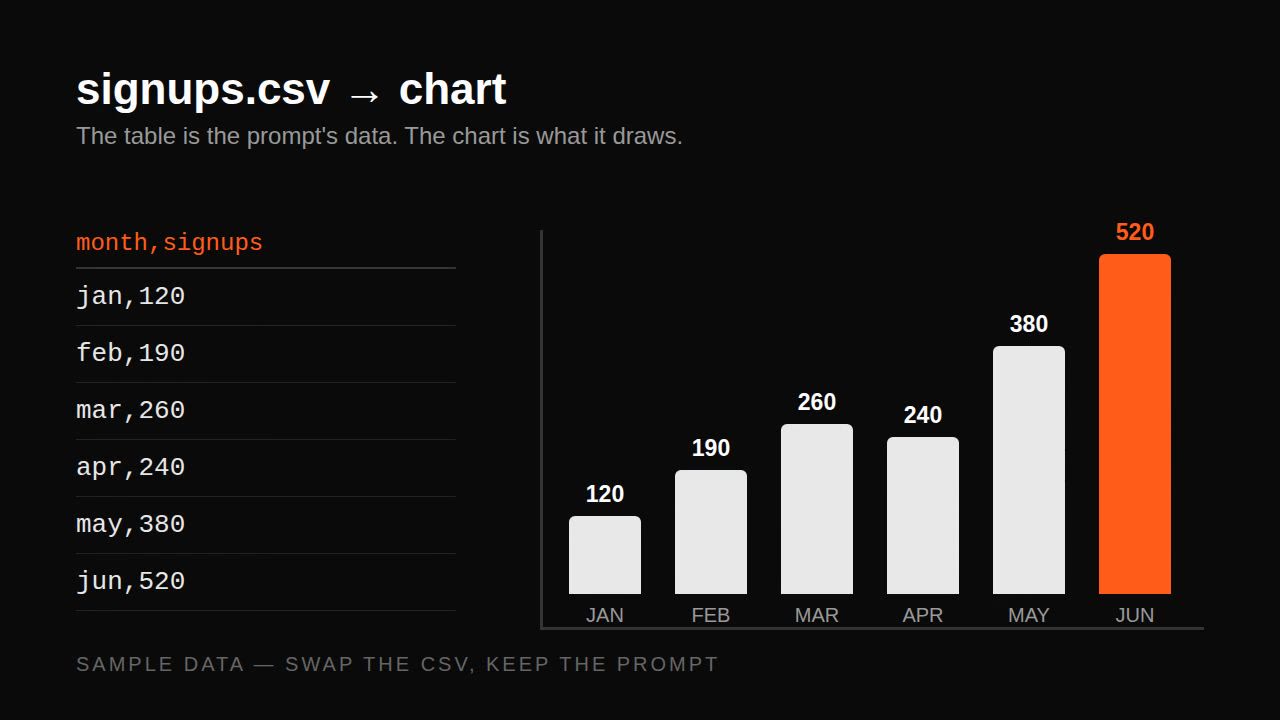
Remotion data prompt — CSV to animated bar chart
Remotion·Landscape Tested