Duration — 1280×720 · 16:9 landscape Remotion Remotion + React
Run log
ModelClaude (agent build)
Renderer / stackRemotion + React
Iterations to final2
Render time26s (final render)
Format1280×720 · 16:9 landscape
Published2026-10-25
What broke (and the fix)
- Iteration 1 still: the final axis label clipped ('YEAR 1' with the 0 cut off), the START/YEAR 1 ticks overlapped, and the moral line collided with the disclaimer — labels re-anchored, tick dropped, lines separated; iteration 2 verified clean.
Original prompt Tested
Compound growth explainer — Remotion prompt (two-line chart, illustrative framing)
by MotionPrompts (own run)
Prompt
Banned list —Beat grid —Build method —Self-review —
<direction>
A 9-second compound-growth explainer in Remotion (1280x720, 270 frames at 30fps). House style: near-black #0a0a0a background, panels #141414, borders #2a2a2a, text #ffffff/#c9c9c9, ONE accent #ff5c1a, Arial/Helvetica bold, no webfonts. Two lines race across one chart — saving alone vs saving plus growth — and the gap teaches the lesson. This is education, never advice: the rate is labelled ILLUSTRATIVE in the title, the legend and the footer. No gradients, no stock photos, no real brand logos, no lorem ipsum, no purple/blue tech gradient.
</direction>
<structure>
Frames 0-44 — Kicker "FINANCE EXPLAINER — COMPOUND GROWTH". Headline: "Same $100 a month. Very different endings." A chart panel with axes (START / YEAR 5 / YEAR 10) and a live YEAR counter top-right.
Frames 44-110 — The grey line draws straight: SAVE ONLY ($100 x 12 x 10 = $12,000 — just the contributions).
Frames 102-190 — The accent curve draws above it, bending upward: SAVE + GROW at an illustrative 7% a year (≈ $17,300 at year 10 — the standard future-value-of-a-series figure, rounded).
Frames 196-270 — Legend cards land with both end values; the moral: "The gap is not the amount. It's the time." Footer, always visible: "EDUCATION ONLY — NOT FINANCIAL ADVICE · 7% IS AN ILLUSTRATION, NOT A PROMISE".
</structure>
<build>
One component; lines are SVG polylines with pathLength=100 and strokeDashoffset driven by clamped interpolate. The YEAR counter derives from the same progress value as the accent line's draw. End values are constants displayed in the legend — compute them once, honestly, and hard-code with the ≈ sign.
</build>
<gotchas>
- Iteration 1 bugs: the YEAR 10 axis label clipped at the SVG edge (anchor it "end"), START and YEAR 1 labels collided (drop the year-1 tick), and the moral overlapped the footer (give each its own line). All fixed in iteration 2 — check the final frame as a still.
- Never let the growth figure appear without the word "illustrative" in the same frame.
- Round the FV figure DOWN to a clean ≈ number; precision theatre reads as a promise.
</gotchas>
Before you finish: step through the timeline at five points and fix anything that overlaps, clips the frame, or drifts off the beat grid.
Use this prompt
Tested after the label fixes (iteration 2). The $17,300 figure is the textbook future value of $100/month for 10 years at 7% (≈$17,310), shown rounded and labelled illustrative.
Related videos
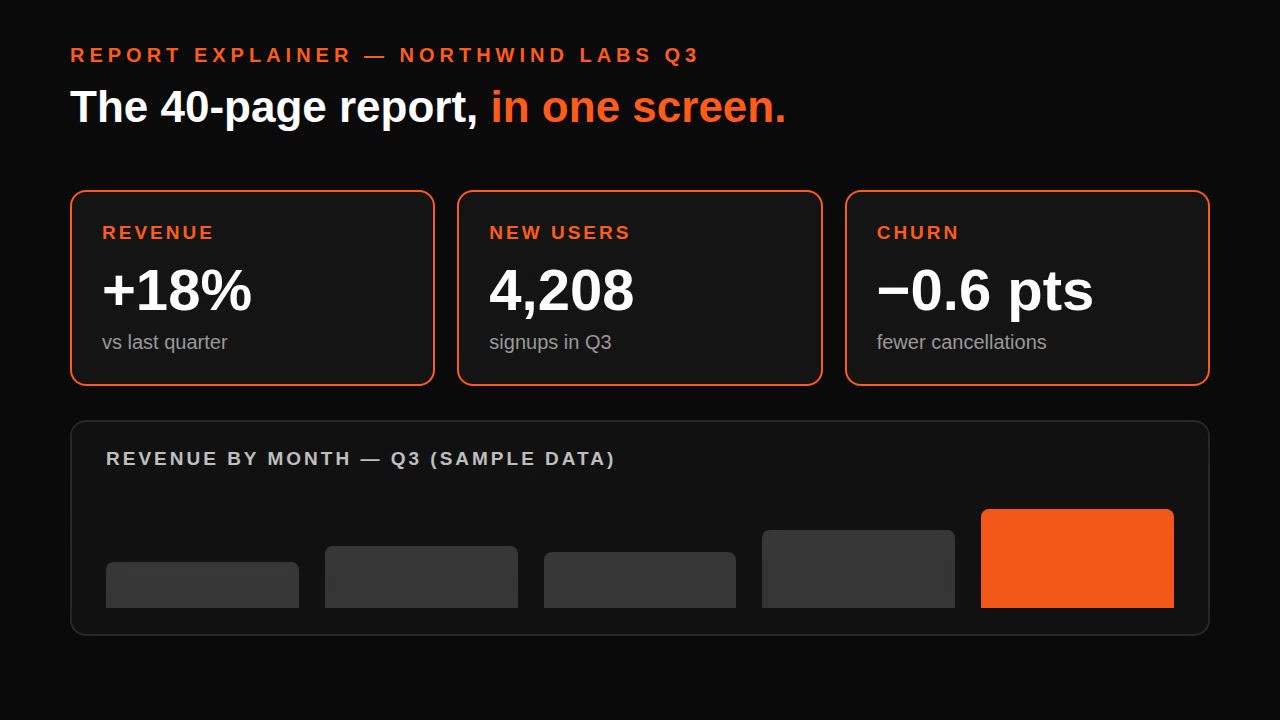
Report explainer — Remotion prompt (dense report condenses to stat cards)
Remotion·16:9 landscape Tested
Product UI morph — one shape, many states
HyperFrames·Square Tested
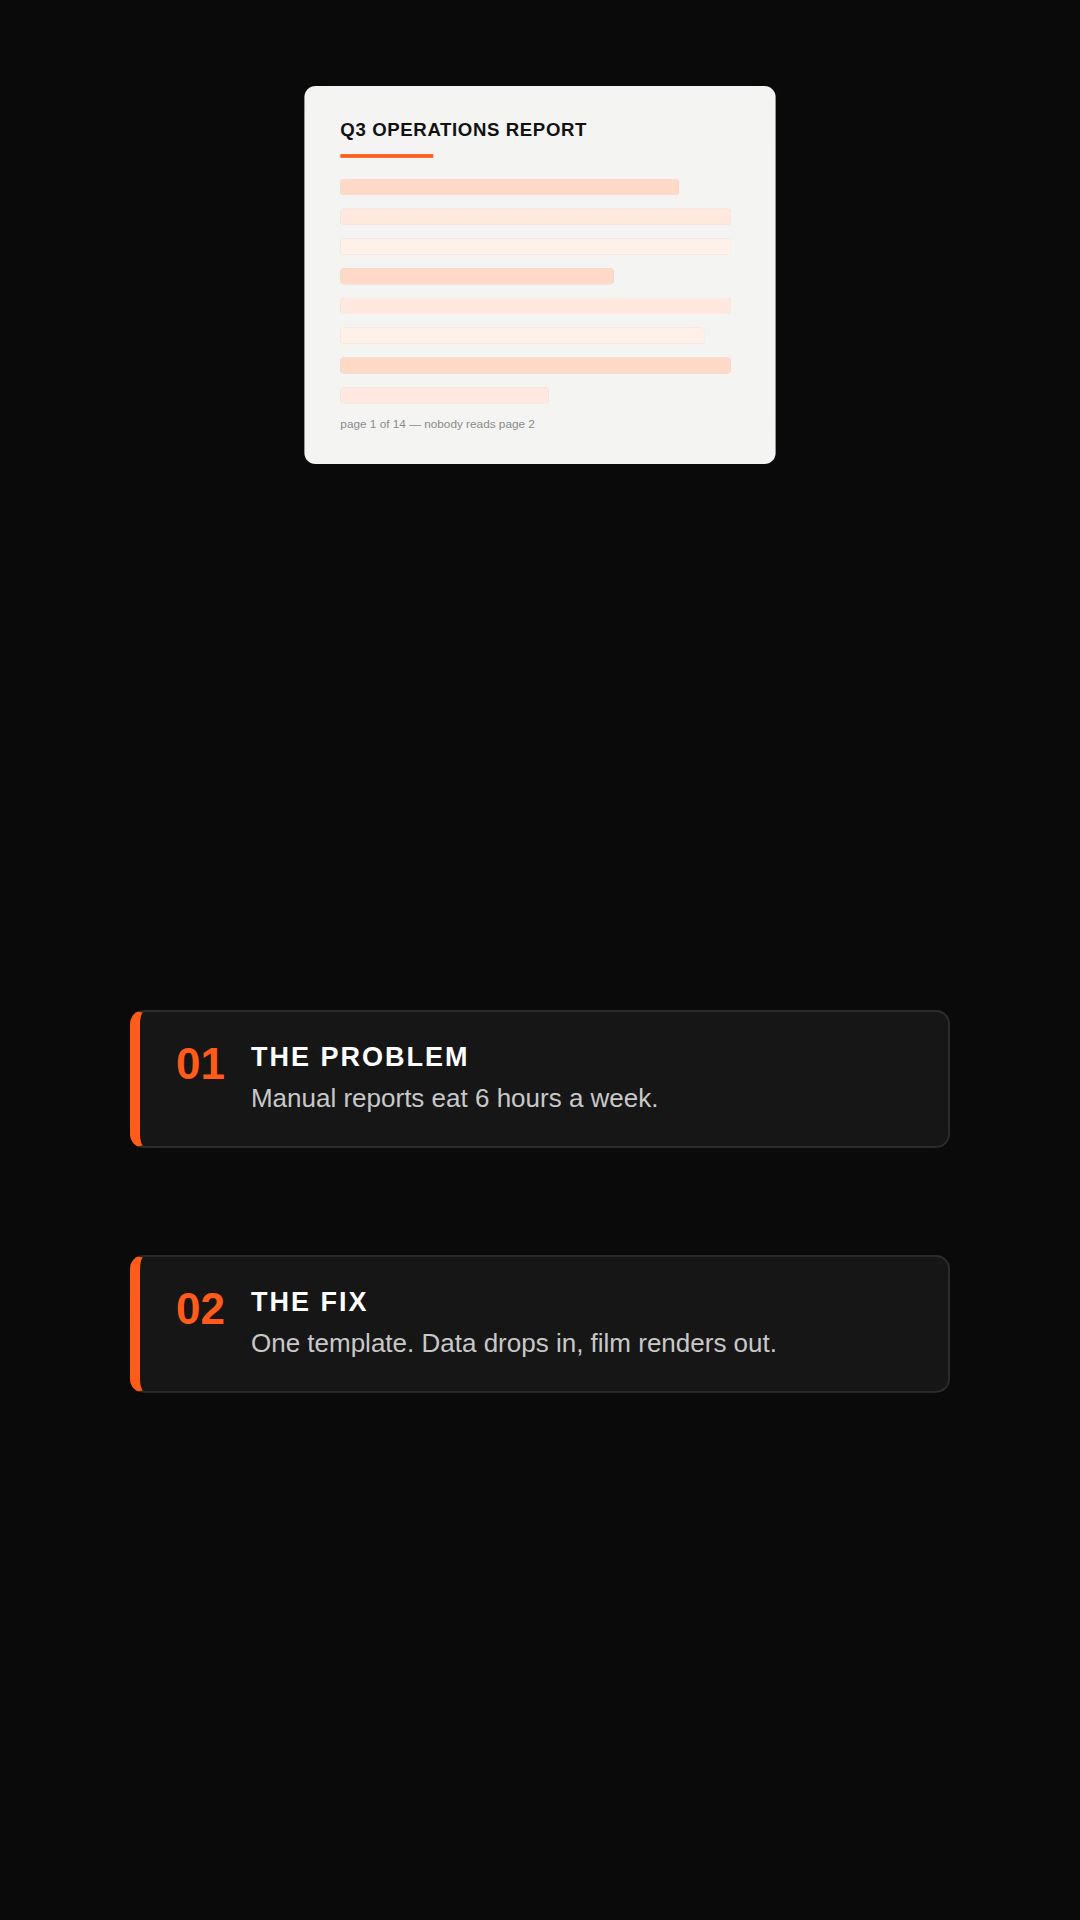
Remotion explainer prompt — document to vertical video
Remotion·Vertical Tested
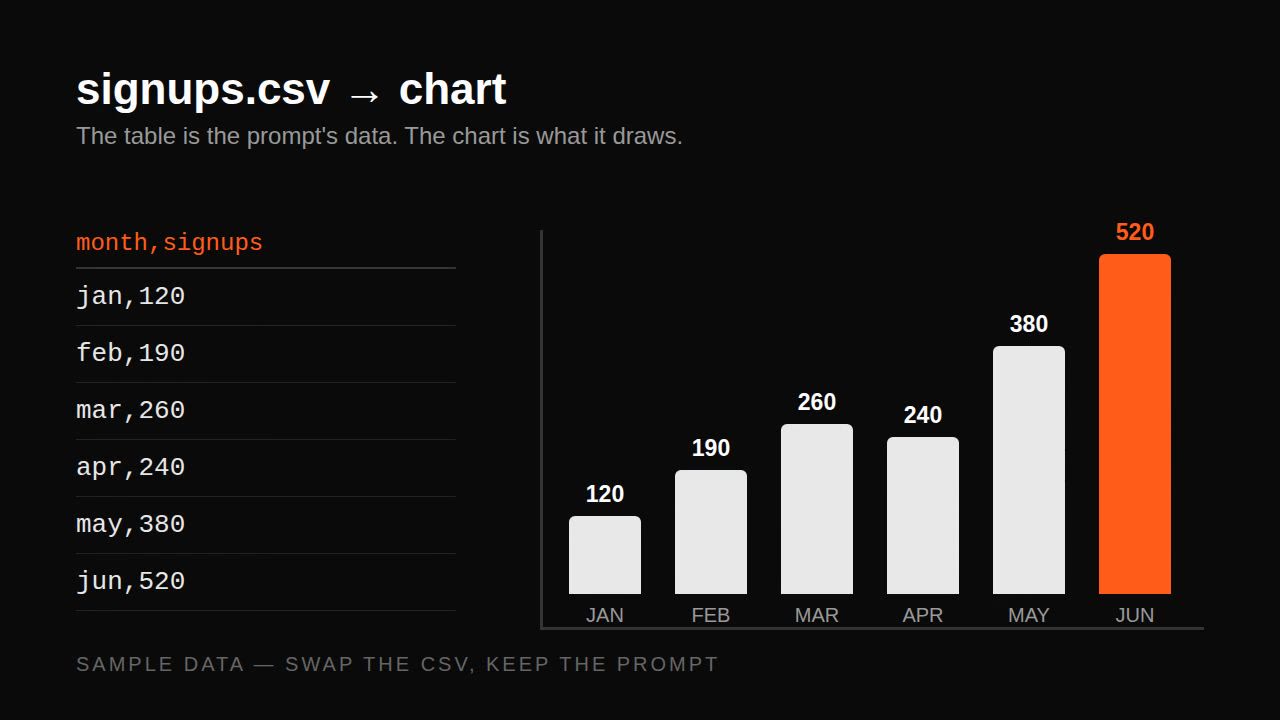
Remotion data prompt — CSV to animated bar chart
Remotion·Landscape Tested