Original prompt — Tested
Claude Motion animated chart prompt — the code route
by MotionPrompts (own run)
Prompt
Banned list ✓Beat grid ✓Build method ✓Self-review ✓
<direction>
An 8-second animated chart film in the style of a Claude Motion request, built with code. At the top, a prompt panel shows the ask being typed: "/motion animate: weekly signups, last 6 weeks, area chart". Below it, the chart draws itself — white line, dots popping per data point, a soft accent area fill — and the headline stat lands: +212%. Sample data, labelled on screen. Near-black background, one orange accent.
Banned: glows, gradients, 3D charts, axis tricks, dashboards full of widgets nobody asked for.
</direction>
<structure>
Beat 1 (0.25–1.6s): the prompt line wipes in inside its panel, command in accent. Beat 2 (1.7–4.5s): the line draws left to right; dots pop as the draw passes them. Beat 3 (3.9–5.0s): area fill fades up under the line. Beat 4 (5.0–5.6s): the headline stat and its caption land top-right. Beat 5: the closer — "ONE PROMPT. ONE CHART. THE CODE ROUTE."
</structure>
<build>
One HyperFrames composition, 1280x720 landscape, seek-driven GSAP timeline. The line draw is strokeDashoffset measured from the path's real length (getTotalLength), never a guessed number. The end dot must sit clear of the stat caption — end the line below the caption chip, not under it.
</build>
<gotchas>
A caption chip over a rising line will swallow the endpoint. We moved the line's final point down so the end dot stays visible — check the settled frame for exactly this before rendering.
</gotchas>
Before you finish: step through the timeline at five points and fix anything that overlaps, clips the frame, or drifts off the beat grid.
Written the way you would ask Claude Motion — one line, /motion style — but built through the code route so anyone on any plan can run it. The prompt panel stays on screen while the chart draws itself.
Run log
| Model | Claude (agent build) |
| Renderer / stack | HyperFrames + GSAP |
| Iterations to final | 3 |
| Render time | 26s (final render) |
| Format | 1280×720 · landscape |
| Published | 2026-10-25 |
 Product UI morph — one shape, many states
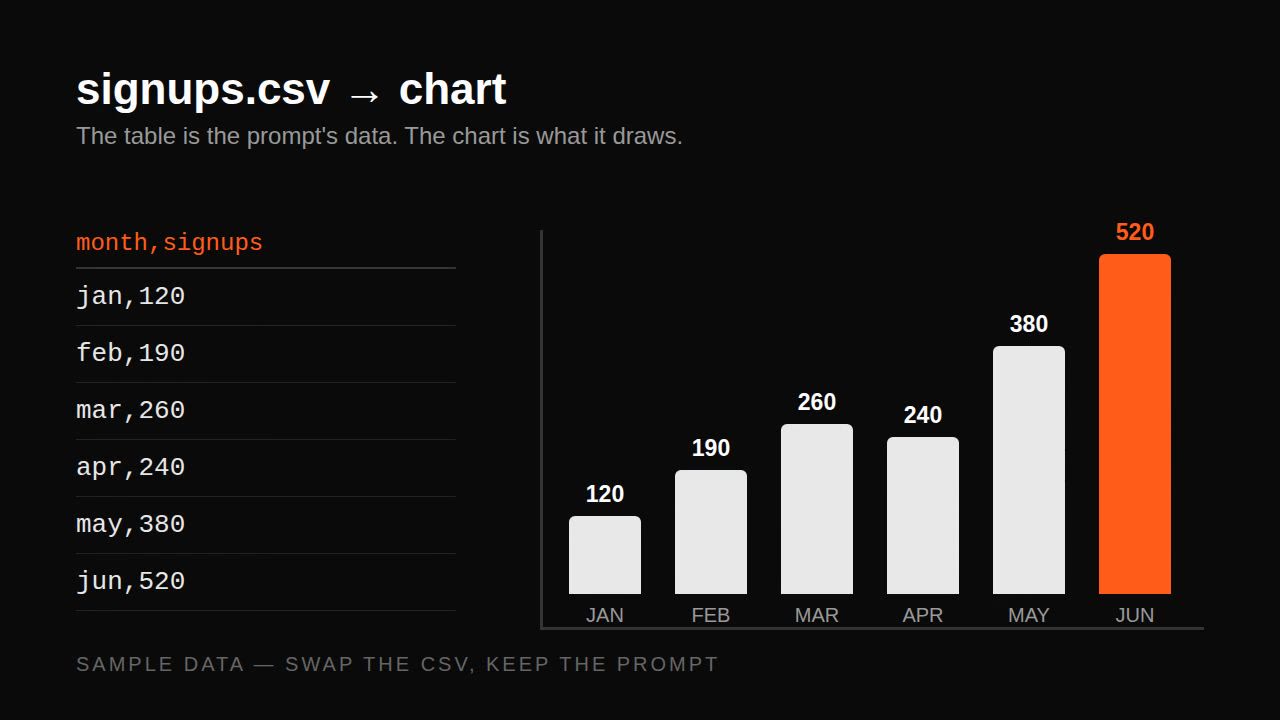 Remotion data prompt — CSV to animated bar chart
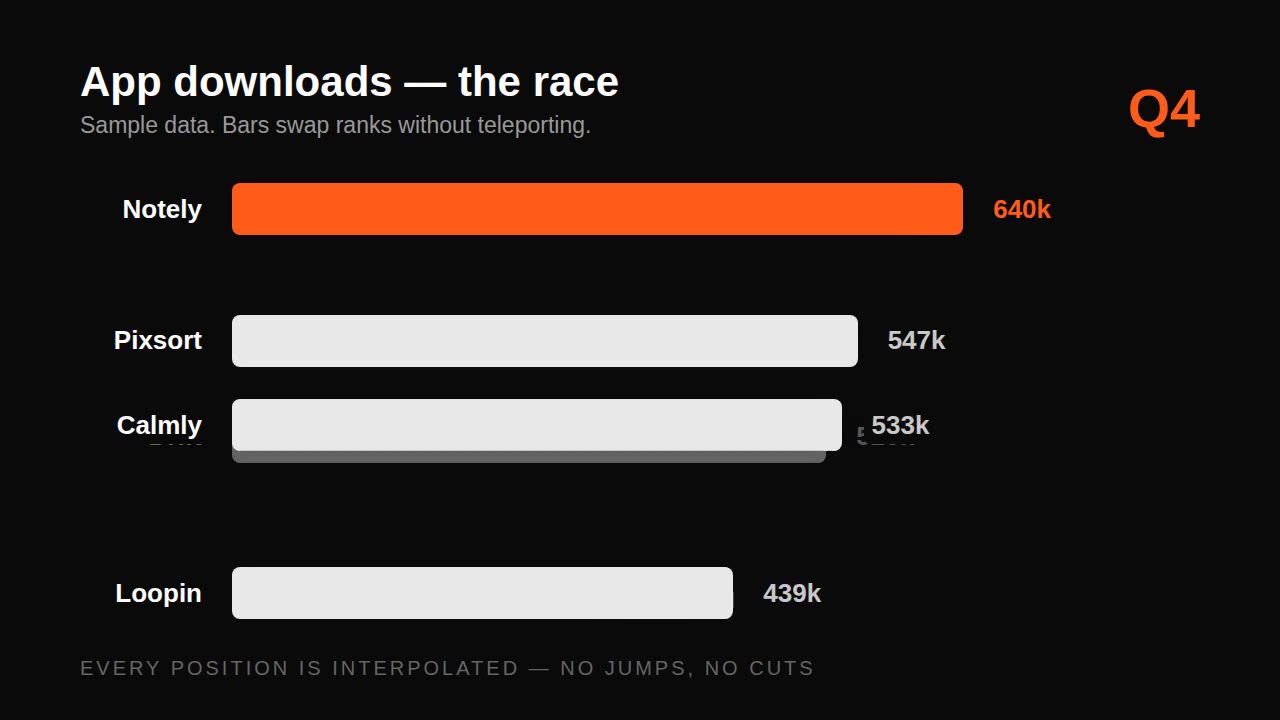 Remotion bar race prompt — rankings over time
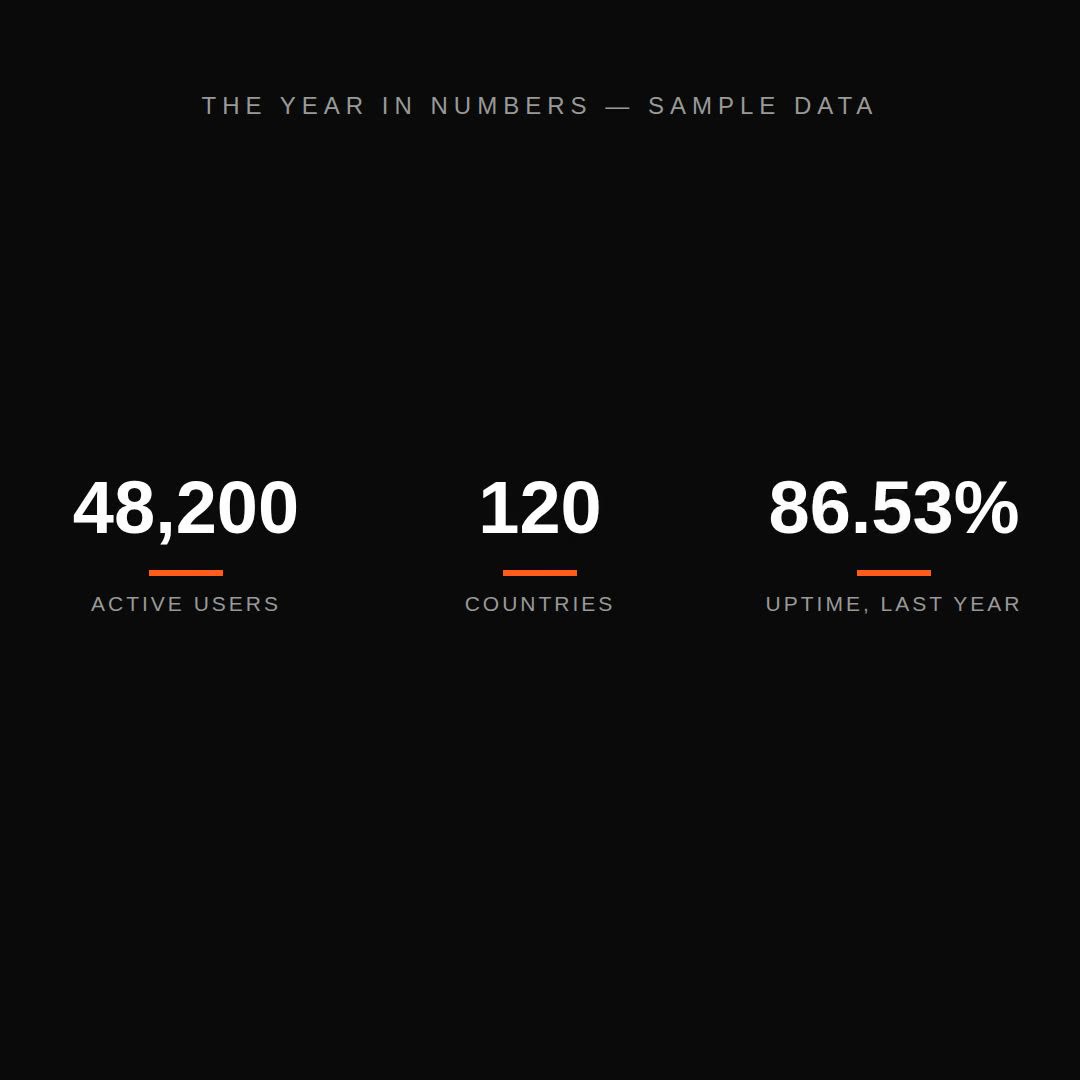 Remotion count-up stats prompt — number story