Duration — 1280×720 · 16:9 landscape HyperFrames HyperFrames + GSAP
Run log
ModelClaude (agent build)
Renderer / stackHyperFrames + GSAP
Iterations to final1
Render time21s (final render)
Format1280×720 · 16:9 landscape
Published2026-10-25
What broke (and the fix)
- Nothing broke — check passed first try and the first render shipped.
Original prompt Tested
Dashboard launch film — HyperFrames prompt (product window builds itself)
by MotionPrompts (own run)
Prompt
Banned list —Beat grid —Build method —Self-review —
<direction>
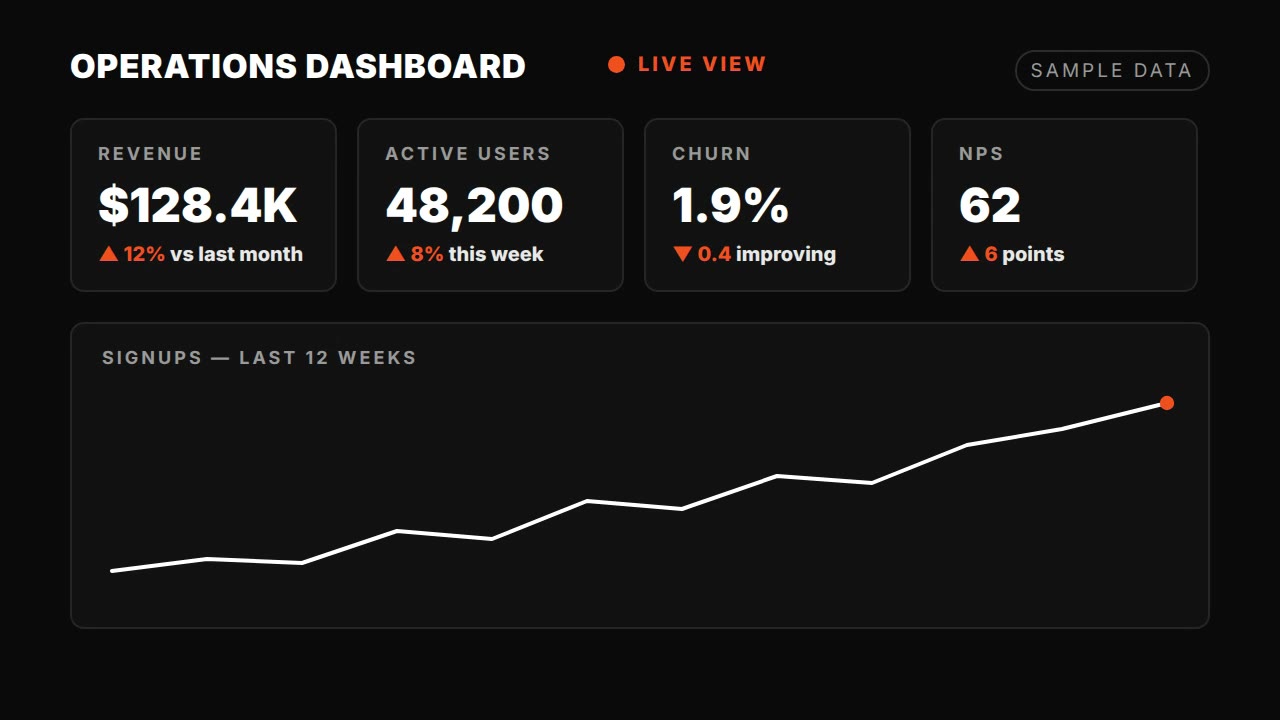
A 9-second dashboard launch film, HyperFrames 1280x720 at 30fps. House style: near-black #0a0a0a background, panels #141414, borders #2a2a2a, text #ffffff/#c9c9c9, ONE accent #ff5c1a, Arial/Helvetica bold, no webfonts. This run's accent: #ff5c1a. Instead of describing the analytics product, the film lets the dashboard build itself in front of you — counters, chart, bars — with every number labelled demo data. Fictional product. No gradients, no stock photos, no real brand logos, no lorem ipsum, no purple/blue tech gradient.
</direction>
<structure>
0.0-2.0s — Kicker "DASHBOARD LAUNCH FILM — Pulseboard". The headline "EVERY METRIC. ONE BOARD." slams in and clears.
2.0-3.4s — A browser window rises: window dots, a ".example" URL, a LIVE pill with a pulsing dot, a sidebar with the active item in accent.
2.4-4.3s — Three KPI cards stagger in; their counters animate to 8,421 / $129,480 / 4.8% and land exactly.
3.4-5.6s — The line chart draws itself left to right (stroke-dashoffset), end dot pops; four bars grow with the tallest in accent.
5.6-9.0s — Everything holds alive (LIVE dot keeps pulsing); bottom band: fictional product, all numbers demo data.
</structure>
<build>
One paused GSAP timeline. Chart draw = getTotalLength() into strokeDasharray/Dashoffset on load, then a tween to 0. Counters = object tweens with onUpdate formatting. The LIVE pulse is a short yoyo tween inside the same timeline (finite repeats, so the seek capture stays deterministic).
</build>
<gotchas>
- getTotalLength must run before the first seek or the dash math is wrong.
- Counter end values must be the exact final text at the last frame — format in onUpdate, not after.
- The window must be fully built before the counters start; overlap by ~0.15s only.
</gotchas>
Before you finish: step through the timeline at five points and fix anything that overlaps, clips the frame, or drifts off the beat grid.
Use this prompt
Runs verbatim. The build-itself structure is the pitch: any dashboard product can swap in its own KPIs and chart path.